1976 United States presidential election in Delaware
 | ||||||||||||||||||||||||||
| ||||||||||||||||||||||||||
 County Results Carter 50-60%
| ||||||||||||||||||||||||||
| ||||||||||||||||||||||||||
The 1976 United States presidential election in Delaware took place on November 2, 1976, as part of the 1976 United States presidential election. State voters chose three representatives, or electors, to the Electoral College, who voted for president and vice president.
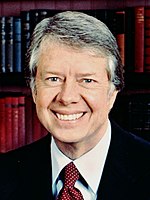
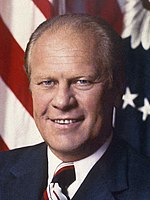
Delaware was won by Jimmy Carter (D–Georgia), with 51.98% of the popular vote. Carter defeated incumbent President Gerald Ford (R–Michigan), who finished with 46.57% of the popular vote. Eugene McCarthy (Independent–Minnesota) finished third in Delaware with 1.03% of the statewide popular vote.
This was the last time that a Marxist political party appeared on the presidential ballot in Delaware until the 2008 election when the Socialist Workers Party appeared on the ballot.[1] Had Ford won Ohio and Delaware, the election would have been a 269-269 tie.
Results
| Party | Candidate | Votes | % | |
|---|---|---|---|---|
| Democratic | Jimmy Carter | 122,596 | 51.98% | |
| Republican | Gerald Ford (inc.) | 109,831 | 46.57% | |
| Independent | Eugene McCarthy | 2,437 | 1.03% | |
| American | Thomas J. Anderson | 645 | 0.27% | |
| U.S. Labor | Lyndon LaRouche | 136 | 0.06% | |
| Prohibition | Benjamin Bubar Jr. | 103 | 0.04% | |
| Socialist Labor | Jules Levin | 86 | 0.04% | |
| Total votes | 235,834 | 100.00% | ||
Results by county
| County | Jimmy Carter Democratic | Gerald Ford Republican | Various candidates Other parties | Margin | Total votes cast | ||||
|---|---|---|---|---|---|---|---|---|---|
| # | % | # | % | # | % | # | % | ||
| Kent | 16,523 | 56.15% | 12,604 | 42.83% | 301 | 1.02% | 3,919 | 13.32% | 29,428 |
| New Castle | 87,521 | 51.38% | 80,074 | 47.01% | 2,743 | 1.61% | 7,447 | 4.37% | 170,338 |
| Sussex | 18,552 | 51.44% | 17,153 | 47.56% | 363 | 1.00% | 1,399 | 3.88% | 36,068 |
| Totals | 122,596 | 51.98% | 109,831 | 46.57% | 3,407 | 1.45% | 12,765 | 5.41% | 235,834 |
Counties that flipped from Republican to Democratic
See also
References
- ^ "Socialist Workers On in Delaware for First Time Ever". Ballot Access News. July 10, 2008. Archived from the original on August 5, 2020.
- ^ "1976 Presidential General Election Results - Delaware". Dave Leip's Atlas of U.S. Presidential Elections. Archived from the original on January 20, 2022.


