1996 UK local government election
The 1996 Brighton and Hove Borough Council election was held on 9 May 1996 to elect members to the new unitary authority of Brighton and Hove Borough Council in East Sussex, England. It was the inaugural election to the new council, and was held nearly a year before the council formally came into being on 1 April 1997, replacing the former Brighton Borough Council and Hove Borough Council. The councillors elected in May 1996 served as a shadow authority alongside the outgoing councils, overseeing the transition to the new arrangements, until coming into their powers in April 1997.
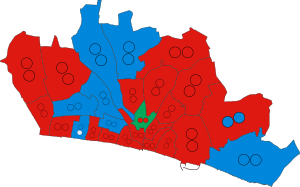
The whole council was up for election, and all 78 councillors were elected from 26 wards.[1] The ward boundaries were the same as the old boundaries used in previous elections for the two predecessor authorities.
The result was a clear Labour victory, with the party winning an overall majority of seats. Labour had previously controlled both predecessor authorities: Brighton Borough Council since 1986, and Hove Borough Council since 1995.
Summary
Comparison with the previous councils
The wards and number of seats in each wards remained the same as the respective borough councils and therefore the swing and incumbents are all technically nominal.
Comparison with Brighton Borough and Hove Borough Councils | Party | Brighton and Hove
Borough Council
1996 | Pre merger councils |
| Brighton Borough (thirds) | Hove Borough (all out) | Total (nominal) |
| 1992 | 1994 | 1995 | 1995 |
| Seats | % | Seats | % | Seats | % | Seats | % | Seats | % | Seats | % |
| | Labour | 54 | 46.7 | 3 | 32.6 | 12 | 49.6 | 13 | 55.7 | 11 | 44.1 | 39 | 45.5 |
| | Conservative | 22 | 32.6 | 13 | 55.1 | 4 | 32.6 | 3 | 29.7 | 16 | 33.8 | 36 | 37.8 |
| | Green Party | 1 | 8.6 | 0 | 4.8 | 0 | 4.3 | 0 | 4.8 | 0 | 5.8 | 0 | 4.9 |
| | Liberal Democrat | 0 | 9.1 | 0 | 7.6 | 0 | 13.1 | 0 | 9.2 | 3 | 16 | 3 | 11.5 |
| | Independent | 1 | 1.3 | 0 | 0 | 0 | 0 | 0 | 0.1 | 0 | 0.2 | 0 | 0.1 |
Election result
| 1996 Brighton and Hove Borough Council election |
| Party | Candidates | Seats | Gains | Losses | Net gain/loss | Seats % | Votes % | Votes | +/− |
| | Labour | 78 | 54 | 12 | 2 |  10 10 | 69.2 | 51.0 | 105,903 | N/A |
| | Conservative | 77 | 22 | 1 | 10 |  9 9 | 28.2 | 35.5 | 73,684 | N/A |
| | Green | 28 | 1 | 1 | 0 | 1 | 1.3 | 4.1 | 8,585 | N/A |
| | Ind. Conservative | 9 | 1 | 1 | 0 | 1 | 1.3 | 1.4 | 2,906 | N/A |
| | Liberal Democrats | 59 | 0 | 0 | 3 | 3 | 0.0 | 7.8 | 16,260 | N/A |
| | Residents | 1 | 0 | 0 | 0 |  | 0.0 | 0.1 | 227 | N/A |
| | Militant Labour | 1 | 0 | 0 | 0 | | 0.0 | 0.1 | 162 | N/A |
Council composition
After the inaugural elections the composition of the council was compared to its previous consistent councils.
Brighton Borough Council composition after the election in 1995 was:
Hove Borough Council composition after the election in 1995 was:
After the inaugural election in 1996 the composition of the council was:
Ward results
Candidates who were previously councillors in the Brighton Borough Council or Hove Borough Council are indicated with a (*)
Brunswick and Adelaide
Brunswick and Adelaide (3) | Party | Candidate | Votes | % |
| | Labour | Davies C. | 941 | 40.4 |
| | Labour | Hunt F. Ms. | 919 | 39.5 |
| | Labour | McGinley J. | 841 | 36.1 |
| | Liberal Democrats | Hillman J.* | 749 | 32.2 |
| | Liberal Democrats | Wakeling J. Ms.* | 691 | 29.7 |
| | Liberal Democrats | Vivian P. Ms. | 671 | 28.8 |
| | Conservative | Hunter S. Ms. | 610 | 26.2 |
| | Conservative | Boustead C. | 604 | 25.9 |
| | Conservative | Mitchell J. | 583 | 25.0 |
| | Green | Nightengale K. | 230 | 9.9 |
| Turnout | 2,329 | 30.7 |
| Registered electors | 7,587 | |
| | Labour gain from Liberal Democrats |
| | Labour gain from Liberal Democrats |
| | Labour gain from Liberal Democrats |
Goldsmid
Goldsmid (3) | Party | Candidate | Votes | % |
| | Conservative | Langston J. Ms.* | 1,330 | 49.5 |
| | Conservative | Langston S.* | 1,294 | 48.2 |
| | Conservative | Jordan B.* | 1,292 | 48.1 |
| | Labour | Bower S. Lab | 1,145 | 42.6 |
| | Labour | Visor V. Ms. | 1,118 | 41.6 |
| | Labour | Ralfe B. | 1,064 | 39.6 |
| | Liberal Democrats | Thomas P. Ms. | 246 | 9.2 |
| | Liberal Democrats | Driffill B. | 237 | 8.8 |
| | Green | Hudson G. | 225 | 8.4 |
| | Liberal Democrats | Taylor S. | 224 | 8.3 |
| Turnout | 2,686 | 36.7 |
| Registered electors | 7,318 | |
| | Conservative hold |
| | Conservative hold |
| | Conservative hold |
Hangleton
Hangleton (3) | Party | Candidate | Votes | % |
| | Labour | Keilty G.* | 1,421 | 51.9 |
| | Labour | Newland D. | 1,309 | 47.8 |
| | Labour | Walshe B. Ms.* | 1,300 | 47.5 |
| | Conservative | Willows P. | 1,090 | 39.8 |
| | Conservative | Jackson M. | 1,066 | 39.0 |
| | Conservative | Jackson G. | 1,055 | 38.6 |
| | Liberal Democrats | Walls M. Ms | 185 | 6.8 |
| | Liberal Democrats | Bates E. | 167 | 6.1 |
| | Liberal Democrats | Bickle P. Ms | 164 | 6.0 |
| | Green | McHenry J. Ms. | 99 | 3.6 |
| Turnout | 2,736 | 43.1 |
| Registered electors | 6,348 | |
| | Labour hold |
| | Labour hold |
| | Labour hold |
Hanover
Hanover (3) | Party | Candidate | Votes | % |
| | Labour | Smith J. Ms.* | 2,100 | 71.5 |
| | Labour | Schaffer S. Ms.* | 1,990 | 67.8 |
| | Labour | Morley C. | 1,789 | 60.9 |
| | Green | Chapman K. Ms. | 665 | 22.6 |
| | Conservative | Dudeney R. Ms. | 380 | 12.9 |
| | Conservative | Jackson G. | 338 | 11.5 |
| | Conservative | Radford-Kirby E. Ms. | 323 | 11.0 |
| | Liberal Democrats | Cornelius C. | 296 | 10.1 |
| Turnout | 2,936 | 34.7 |
| Registered electors | 8,461 | |
| | Labour hold |
| | Labour hold |
| | Labour hold |
Hollingbury
Hollingbury (3) | Party | Candidate | Votes | % |
| | Labour | David Lepper* | 1,891 | 77.9 |
| | Labour | Lepper J. Ms. | 1,798 | 74.1 |
| | Labour | Finch B.* | 1,742 | 71.8 |
| | Conservative | Franklin C. Ms. | 384 | 15.8 |
| | Conservative | McGrath M. | 377 | 15.5 |
| | Conservative | Norman K. | 359 | 14.8 |
| | Green | Gardner P. | 276 | 11.4 |
| | Liberal Democrats | Lamb D. | 266 | 11.0 |
| | Liberal Democrats | Powell D. | 194 | 8.0 |
| Turnout | 2,426 | 32.1 |
| Registered electors | 7,556 | |
| | Labour hold |
| | Labour hold |
| | Labour hold |
Kings Cliff
Kings Cliff (3) | Party | Candidate | Votes | % |
| | Labour | Duncan I.* | 1,577 | 66.5 |
| | Labour | Burgess S.* | 1,567 | 66.1 |
| | Labour | Mitchell G. Ms.* | 1,529 | 64.5 |
| | Conservative | Radford D. Ms. | 634 | 26.8 |
| | Conservative | Sampson S. | 593 | 25.0 |
| | Conservative | Amin J. | 589 | 24.9 |
| | Green | Hodd J. Ms. | 235 | 9.9 |
| | Liberal Democrats | Jones M. | 217 | 9.2 |
| Turnout | 2,370 | 35.4 |
| Registered electors | 6,696 | |
| | Labour hold |
| | Labour hold |
| | Labour hold |
Marine
Marine (3) | Party | Candidate | Votes | % |
| | Labour | Marsh M. Ms.* | 1,347 | 59.1 |
| | Labour | Desmond Turner | 1,309 | 57.4 |
| | Labour | Johnston M. | 1,275 | 55.9 |
| | Conservative | Mears M. Ms.* | 1,003 | 44.0 |
| | Conservative | Smith D. | 916 | 40.2 |
| | Conservative | Fairs B. Ms. | 906 | 39.8 |
| | Militant Labour | Dale K. | 162 | 7.1 |
| | Liberal Democrats | Clements I. | 140 | 6.1 |
| | Green | Coyne B. Ms. | 133 | 5.8 |
| | Liberal Democrats | Howard P. Ms. | 126 | 5.5 |
| | Liberal Democrats | Howard A. | 114 | 5.0 |
| Turnout | 2,279 | 29.2 |
| Registered electors | 7,803 | |
| | Labour hold |
| | Labour hold |
| | Labour gain from Conservative |
Moulsecoomb
Moulsecoomb (3) | Party | Candidate | Votes | % |
| | Labour | Meadows A. Ms.* | 1,097 | 62.9 |
| | Labour | Hazelgrove J. | 1,079 | 61.9 |
| | Labour | Tonks F.* | 1,019 | 58.4 |
| | Conservative | Gunn K. Ms.* | 407 | 23.3 |
| | Conservative | Amiet J. Ms. | 399 | 22.9 |
| | Conservative | Stevens J. | 375 | 21.5 |
| | Residents | Avey C. | 227 | 13.0 |
| | Liberal Democrats | Lovatt J. | 179 | 10.3 |
| | Green | Mills A. Ms. | 127 | 7.3 |
| Turnout | 1,744 | 27.1 |
| Registered electors | 6,435 | |
| | Labour hold |
| | Labour gain from Conservative |
| | Labour hold |
Nevill
Nevill (3) | Party | Candidate | Votes | % |
| | Conservative | Lewis P. | 1,406 | 50.3 |
| | Conservative | Worgan M. | 1,398 | 50.1 |
| | Conservative | Wade S. | 1,325 | 48.4 |
| | Labour | James H. Ms. | 1,250 | 44.8 |
| | Labour | Anthony D. | 1,242 | 44.5 |
| | Labour | Spillman H. | 1,133 | 40.6 |
| | Liberal Democrats | Alldred E. | 187 | 6.7 |
| | Green | Phillips J. Ms. | 123 | 4.4 |
| Turnout | 2,793 | 45.3 |
| Registered electors | 6,165 | |
| | Conservative hold |
| | Conservative gain from Labour |
| | Conservative hold |
North Portslade
North Portslade (3) | Party | Candidate | Votes | % |
| | Labour | Carden B.* | 1,720 | 70.3 |
| | Labour | Steer H. | 1,686 | 68.9 |
| | Labour | Turner D. | 1,638 | 66.9 |
| | Conservative | Saunders D. Ms. | 634 | 25.9 |
| | Conservative | Braybrook B. | 608 | 24.8 |
| | Conservative | Hess M. | 533 | 21.8 |
| | Green | Gray K. | 157 | 6.4 |
| Turnout | 2,448 | 35.1 |
| Registered electors | 6,975 | |
| | Labour hold |
| | Labour hold |
| | Labour hold |
Patcham
Patcham (3) | Party | Candidate | Votes | % |
| | Conservative | Theobald C. Ms.* | 2,156 | 59.3 |
| | Conservative | Theobald G.* | 2,153 | 59.2 |
| | Conservative | Sheldon J. | 2,076 | 57.1 |
| | Labour | Blackwood R. | 1,115 | 30.6 |
| | Labour | Blackwood M. Ms. | 1,114 | 30.6 |
| | Labour | Miller H. | 1,005 | 27.6 |
| | Liberal Democrats | De Souza J. Ms. | 469 | 12.9 |
| | Liberal Democrats | Latimer D. | 359 | 9.9 |
| | Liberal Democrats | Latimer D. Ms. | 356 | 9.8 |
| | Green | Haase A. | 99 | 2.7 |
| Turnout | 3,638 | 52.5 |
| Registered electors | 6,929 | |
| | Conservative hold |
| | Conservative hold |
| | Conservative hold |
Portslade South
Portslade South (3) | Party | Candidate | Votes | % |
| | Labour | Ivor Caplin* | 1,611 | 61.2 |
| | Labour | Collier S.* | 1,552 | 59.0 |
| | Labour | John S. Ms.* | 1,434 | 55.0 |
| | Conservative | Kemble E. | 709 | 26.9 |
| | Conservative | Greenwood C. Ms. | 704 | 28.8 |
| | Conservative | Veale M. | 681 | 25.9 |
| | Liberal Democrats | Donovan N. | 300 | 11.4 |
| | Liberal Democrats | James I. | 295 | 11.2 |
| | Green | Mylton-Thorley M. Ms. | 95 | 3.6 |
| Turnout | 2,631 | 38.4 |
| Registered electors | 6,851 | |
| | Labour hold |
| | Labour hold |
| | Labour hold |
Preston
Preston (3) | Party | Candidate | Votes | % |
| | Labour | McCaffery J. Ms. | 1,803 | 52.2 |
| | Labour | Austin L. Ms. | 1,792 | 51.9 |
| | Labour | Spray J. Ms.* | 1,756 | 50.9 |
| | Conservative | Mallender G. Con | 1,264 | 36.6 |
| | Conservative | Marchant V.* | 1,262 | 36.5 |
| | Conservative | Nilchiber K. | 1,262 | 36.5 |
| | Liberal Democrats | Hunter T. | 334 | 9.7 |
| | Liberal Democrats | Potts S. | 294 | 8.5 |
| | Liberal Democrats | Schelwald E. | 255 | 7.4 |
| | Green | Littman L. | 254 | 7.4 |
| Turnout | 3,453 | 44.9 |
| Registered electors | 7,690 | |
| | Labour hold |
| | Labour gain from Conservative |
| | Labour hold |
Queens Park
Queens Park (3) | Party | Candidate | Votes | % |
| | Labour | Lythell J.* | 1,623 | 67.6 |
| | Labour | Bodfish K. | 1,566 | 65.3 |
| | Labour | Townsend J.* | 1,540 | 64.2 |
| | Conservative | Allaway H. | 621 | 25.9 |
| | Conservative | Vivian S. Ms. | 601 | 25.0 |
| | Conservative | Wells S. Ms. | 562 | 23.4 |
| | Green | Chadwick S. Ms | 275 | 11.5 |
| | Liberal Democrats | Blease J. Ms. | 195 | 8.1 |
| | Liberal Democrats | Blease J. | 192 | 8.0 |
| Turnout | 2,400 | 38.0 |
| Registered electors | 6,316 | |
| | Labour hold |
| | Labour gain from Conservative |
| | Labour hold |
Regency
Regency (3) | Party | Candidate | Votes | % |
| | Labour | Ping N.* | 1,553 | 59.2 |
| | Labour | Pennington R.* | 1,430 | 54.5 |
| | Labour | Warmington J. | 1,404 | 53.5 |
| | Conservative | Cameron J. | 776 | 29.6 |
| | Conservative | Boggon M.* | 758 | 28.9 |
| | Conservative | Cockman D. | 741 | 28.3 |
| | Green | Hyde Parker A. | 347 | 13.2 |
| | Liberal Democrats | Freeman T. | 257 | 9.8 |
| | Liberal Democrats | Guild J. | 241 | 9.2 |
| | Liberal Democrats | Cotton E. | 203 | 7.7 |
| Turnout | 2,623 | 36.3 |
| Registered electors | 7,227 | |
| | Labour hold |
| | Labour hold |
| | Labour gain from Conservative |
Rottingdean
Rottingdean (3) | Party | Candidate | Votes | % |
| | Conservative | Wrigley S. Ms.* | 1,745 | 54.8 |
| | Conservative | Hunt B. | 1,738 | 54.6 |
| | Conservative | Simon Radford-Kirby | 1,697 | 53.3 |
| | Labour | Bunting M. | 783 | 24.6 |
| | Labour | Moriarty J. | 732 | 23.0 |
| | Labour | Gray A. Ms. | 715 | 22.5 |
| | Liberal Democrats | Davidson D. Ms. | 470 | 14.8 |
| | Liberal Democrats | De Souza H. | 470 | 14.8 |
| | Liberal Democrats | Edwards P. | 437 | 13.7 |
| | Ind. Conservative | Grant M. | 201 | 6.3 |
| | Ind. Conservative | Wright N.* | 193 | 6.1 |
| | Ind. Conservative | Wright A. Ms. | 181 | 5.7 |
| | Green | Berrington J. | 113 | 3.6 |
| Turnout | 3,183 | 41.7 |
| Registered electors | 7,633 | |
| | Conservative hold |
| | Conservative hold |
| | Conservative hold |
Seven Dials
Seven Dials (3) | Party | Candidate | Votes | % |
| | Labour | Austin R. | 1,784 | 76.0 |
| | Labour | Middleton M.* | 1,684 | 71.8 |
| | Labour | Robinson N.* | 1,680 | 71.6 |
| | Conservative | Bowes P. | 437 | 18.6 |
| | Conservative | Gowans J. | 437 | 18.6 |
| | Conservative | Larkin R. Ms. | 414 | 17.6 |
| | Green | Needham I. | 358 | 15.3 |
| | Liberal Democrats | Heale R. | 269 | 11.5 |
| | Liberal Democrats | Oldfield E. Ms. | 233 | 9.9 |
| | Liberal Democrats | Huggins B. | 231 | 9.8 |
| Turnout | 2,346 | 31.8 |
| Registered electors | 7,377 | |
| | Labour hold |
| | Labour hold |
| | Labour hold |
St. Peters
St. Peters (3) | Party | Candidate | Votes | % |
| | Green | Pete West | 1,576 | 41.9 |
| | Labour | Charleton S. | 1,517 | 40.4 |
| | Labour | Gwyn-Jones L. Ms.* | 1,451 | 38.6 |
| | Labour | Simpson C. Ms.* | 1,408 | 37.5 |
| | Green | Whale R. Ms. | 973 | 25.9 |
| | Green | Young F. Ms. | 845 | 22.5 |
| | Conservative | Brimmell C. | 311 | 8.3 |
| | Conservative | Maclean E. Ms. | 259 | 6.9 |
| | Conservative | Maclean I. | 237 | 6.3 |
| | Liberal Democrats | Fairweather M. | 199 | 5.3 |
| | Liberal Democrats | Harden W. | 162 | 4.3 |
| | Liberal Democrats | Parker W. | 135 | 3.6 |
| Turnout | 3,757 | 50.1 |
| Registered electors | 7,499 | |
| | Green gain from Labour |
| | Labour hold |
| | Labour hold |
Stanford
Stanford (3) | Party | Candidate | Votes | % |
| | Conservative | Adams M. Ms.* | 1,572 | 66.9 |
| | Conservative | Kapp J.* | 1,525 | 64.9 |
| | Conservative | Rowe B.* | 1,525 | 64.9 |
| | Labour | Jones A. | 478 | 20.3 |
| | Labour | Montague S. | 461 | 19.6 |
| | Labour | Lord S. | 459 | 19.5 |
| | Liberal Democrats | Latham B. | 342 | 14.5 |
| | Liberal Democrats | Innes D. Ms. | 331 | 14.1 |
| | Liberal Democrats | Walls P. | 274 | 11.7 |
| | Green | Jester M. | 92 | 3.9 |
| Turnout | 2,351 | 36.5 |
| Registered electors | 6,441 | |
| | Conservative hold |
| | Conservative hold |
| | Conservative hold |
Stanmer
Stanmer (3) | Party | Candidate | Votes | % |
| | Labour | Framroze T.* | 1,597 | 50.8 |
| | Labour | Hawkes P. Ms.* | 1,589 | 50.6 |
| | Labour | Beishon G. Ms. | 1,551 | 49.4 |
| | Conservative | Careless D. | 922 | 29.4 |
| | Conservative | Fairhall D. | 886 | 28.2 |
| | Conservative | Pacifico M. | 854 | 27.2 |
| | Liberal Democrats | Bailey P. | 258 | 8.2 |
| | Green | Tofts P. | 231 | 7.4 |
| | Liberal Democrats | Imms D. Ms. | 207 | 6.6 |
| | Liberal Democrats | Garrett P. | 207 | 6.6 |
| Turnout | 3,141 | 40.2 |
| Registered electors | 7,814 | |
| | Labour hold |
| | Labour hold |
| | Labour gain from Conservative |
Tenantry
Tenantry (3) | Party | Candidate | Votes | % |
| | Labour | Steve Bassam* | 1,709 | 68.4 |
| | Labour | Ballance J. | 1,581 | 63.2 |
| | Labour | Durr A.* | 1,579 | 63.2 |
| | Conservative | Dudeney D. | 623 | 24.9 |
| | Conservative | Toner M.* | 580 | 23.2 |
| | Conservative | Plater L. | 549 | 22.0 |
| | Green | Santamaria L. | 260 | 10.4 |
| | Liberal Democrats | Weller P. | 241 | 9.5 |
| Turnout | 2,500 | 33.6 |
| Registered electors | 7,539 | |
| | Labour hold |
| | Labour gain from Conservative |
| | Labour hold |
Vallance
Vallance (3) | Party | Candidate | Votes | % |
| | Labour | Battle S. | 1,235 | 48.6 |
| | Labour | Warman-Brown F. Ms.* | 1,217 | 47.9 |
| | Labour | Gibbling M.* | 1,198 | 47.1 |
| | Conservative | Martin P. | 973 | 38.3 |
| | Conservative | Peltzer Dunn G. | 968 | 38.1 |
| | Conservative | Bennett J. Ms. | 941 | 37.0 |
| | Liberal Democrats | Bates K. Ms. | 234 | 9.2 |
| | Liberal Democrats | Denyer P. | 210 | 8.3 |
| | Ind. Conservative | Hogan V. | 208 | 8.2 |
| | Green | Da Costa J. Ms. | 168 | 6.6 |
| | Liberal Democrats | Elgood P. | 167 | 6.6 |
| Turnout | 2,542 | 35.6 |
| Registered electors | 7,141 | |
| | Labour hold |
| | Labour hold |
| | Labour hold |
Westbourne
Westbourne (3) | Party | Candidate | Votes | % |
| | Conservative | Buttimer A. Ms.* | 1,221 | 47.2 |
| | Conservative | Brown V. Ms.* | 1,186 | 45.8 |
| | Ind. Conservative | Oxley B.* | 1,041 | 40.2 |
| | Labour | Cooper R. | 1,008 | 39.0 |
| | Labour | Benians G. | 994 | 38.4 |
| | Labour | Gill P. | 965 | 37.3 |
| | Liberal Democrats | Bull R. Ms. | 305 | 11.8 |
| | Liberal Democrats | Lake J. Ms. | 289 | 11.2 |
| | Liberal Democrats | Hayes D. | 279 | 10.8 |
| | Ind. Conservative | Furness N. | 236 | 9.1 |
| | Green | Mueller M. | 113 | 4.4 |
| Turnout | 2,587 | 35.3 |
| Registered electors | 7,330 | |
| | Conservative hold |
| | Conservative hold |
| | Ind. Conservative gain from Conservative |
Westdene
Westdene (3) | Party | Candidate | Votes | % |
| | Conservative | Drake H.* | 1,656 | 47.0 |
| | Conservative | Drake P. Ms. | 1,624 | 46.1 |
| | Conservative | Norman A. Ms. | 1,514 | 43.0 |
| | Labour | Prentice S. Ms. | 1,402 | 39.8 |
| | Labour | Allen K. | 1,402 | 39.8 |
| | Labour | Matz P. | 1,282 | 36.4 |
| | Ind. Conservative | Humphrey J.* | 327 | 9.3 |
| | Ind. Conservative | Barrett M.* | 299 | 8.5 |
| | Liberal Democrats | McBeth D. | 243 | 6.9 |
| | Liberal Democrats | Rimmington J. Ms. | 222 | 6.3 |
| | Ind. Conservative | Rogers L. Ms. | 220 | 6.2 |
| | Liberal Democrats | Brown P. | 218 | 6.2 |
| | Green | Keenan G. Ms. | 186 | 5.3 |
| Turnout | 3,524 | 47.8 |
| Registered electors | 7,373 | |
| | Conservative hold |
| | Conservative hold |
| | Conservative hold |
Wish
Wish (3) | Party | Candidate | Votes | % |
| | Labour | Bowden C.* | 1,398 | 51.2 |
| | Labour | Murphy P.* | 1,289 | 47.2 |
| | Labour | Pratt A.* | 1,276 | 46.7 |
| | Conservative | Cruikshank-Robb E. | 1,211 | 44.3 |
| | Conservative | Brand S. Ms. | 1,170 | 42.8 |
| | Conservative | Brand L. | 1,160 | 42.5 |
| | Liberal Democrats | Percy A. | 253 | 9.3 |
| | Liberal Democrats | Storey J. | 246 | 9.0 |
| | Green | Baker N. | 189 | 6.9 |
| Turnout | 2,731 | 40.8 |
| Registered electors | 6,695 | |
| | Labour hold |
| | Labour hold |
| | Labour hold |
Woodingdean
Woodingdean (3) | Party | Candidate | Votes | % |
| | Labour | Moorhouse M. Ms.* | 1,635 | 49.0 |
| | Conservative | Wells G. | 1,608 | 48.2 |
| | Conservative | Stiles P. Ms.* | 1,515 | 45.4 |
| | Conservative | Dudeney D. | 1,489 | 44.6 |
| | Labour | Griffiths G. | 1,385 | 41.5 |
| | Labour | Newington J. | 1,325 | 39.7 |
| | Liberal Democrats | Pearce L. Ms. | 325 | 9.7 |
| | Green | Powell V. | 141 | 4.2 |
| Turnout | 3,339 | 44.9 |
| Registered electors | 7,437 | |
| | Labour hold |
| | Conservative hold |
| | Conservative hold |
References
- ^ "Brighton & Hove City Council Election Results 1996-2011" (PDF). electionscentre.co.uk. Archived (PDF) from the original on 20 September 2018.

 10
10  9
9 
 Council elections in East Sussex


