2007 Mississippi elections
|
|
| |
| Elections in Mississippi |
|---|
 |
| |
| |
| |
| |
| Mayoral elections |
|---|
- 2005
- 2009
- 2013
- 2017
- 2021
- 2025
|
|
| Mayoral elections |
|---|
- 2005
- 2009
- 2013
- 2017
- 2021
- 2025
|
|
| Mayoral elections |
|---|
- 2005
- 2009
- 2013
- 2017
- 2021
- 2025
|
|
| Mayoral elections |
|---|
- 2005
- 2009
- 2013
- 2017
- 2021
- 2025
|
|
|
A general election was held in Mississippi on November 6, 2007, to elect to 4 year terms for all members of the Mississippi State Legislature (122 representatives, 52 senators), the offices of Governor of Mississippi, Lieutenant Governor, Secretary of State, Attorney General, State Auditor, State Treasurer, Commissioner of Agriculture and Commerce, and Commissioner of Insurance, plus all three members of the Mississippi Transportation Commission and Mississippi Public Service Commission.[1]
The election was generally a success for Republicans, as they held all their statewide elected offices, and won the open Secretary of State and Insurance Commissioner seats, leaving Attorney General Jim Hood the only statewide elected Democratic officeholder. However, Democrats regained control of the State Senate and maintained their majority in the House of Representatives, won a 2-1 majority on the Public Service Commission, and held their 2-1 majority on the Transportation Commission.
Mississippi State Legislature
All 122 representatives and 52 senators of the Mississippi State Legislature are elected for four-year terms with no staggering of terms. The state legislature draws up separate district maps for the Mississippi House of Representatives and the Mississippi Senate, usually after the federal U.S. Census. There are no term limits for members of both houses of the legislature.
Results for the Mississippi Senate
| Party | Votes | Seats | Loss/Gain | Share of Vote (%) |
| | Democratic | 171,993 | 28 | +3 | |
| | Republican | 161,042 | 24 | -3 | |
| | Constitution | 10,881 | 0 | 0 | |
| | Independent | 3,818 | 0 | 0 | |
| Total | 347,734 | 52 | 0 | 100.0% |
Results for House of Representatives
Statewide officer elections
According to the state constitution, a statewide officer must win both the majority of electoral votes and the majority of the popular vote to be elected.
The number of electoral votes equals the number of Mississippi House of Representatives districts, currently set at 122. A plurality of votes in each House District is required to win the electoral vote for that District. In the event of a tie between the two candidates with the highest votes, the electoral vote is split between them.
In the event an officeholder does not win both the majority electoral and majority popular vote, the House of Representatives shall choose the winner. The Democrats held a large edge (73–46 with three vacancies) in the House, thus ensuring that any contested race will go to the Democratic candidate.
Governor
2007 Mississippi gubernatorial election
|
|
| |
 County results
Barbour: 50–60% 60–70% 70–80%
Eaves: 50–60% 60–70% 70–80% |
|
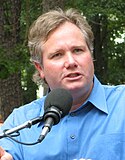
Democratic primary
Candidates
- John Arthur Eaves, Jr.
- William Compton, Jr.
- Fred T. Smith
- Louis Fondren
Results
| Democratic primary - Governor[2] |
| Candidate | Votes | Vote % |
| John Arthur Eaves, Jr. | 314,012 | 70.3 |
| William Compton, Jr. | 52,343 | 11.7 |
| Fred T. Smith | 49,170 | 11.0 |
| Louis Fondren | 31,197 | 7.0 |
| TOTALS | 446,722 | 100 |
Republican primary
Candidates
- Haley Barbour, incumbent
- Frederick Jones
Results
| Republican primary - Governor[3] |
| Candidate | Votes | Vote % |
| Haley Barbour (i) | 184,036 | 93.1 |
| Frederick Jones | 13,611 | 6.9 |
| TOTALS | 197,647 | 100 |
Lieutenant governor
Mississippi Lieutenant Gubernatorial election, 2007
|
| ← 2003 | November 6, 2007 (2007-11-06) | 2011 → |
|
| |  |  | | Nominee | Phil Bryant | Jamie Franks | | | Party | Republican | Democratic | | Popular vote | 432,152 | 305,409 | | Percentage | 58.6% | 41.4% | |
 County results
Bryant: 50–60% 60–70% 70–80% 80–90%
Franks: 50–60% 60–70% 70–80% |
Lieutenant Governor before election
Amy Tuck
Republican | Elected Lieutenant Governor
Phil Bryant
Republican | |
Democratic nomination
Candidates
Results
Democratic primary results[4] | Party | Candidate | Votes | % |
| | Democratic | Jamie Franks | 288,942 | 100 |
| Total votes | 288,942 | 100.0 |
Republican primary
Candidates
Results
Republican primary results[5] | Party | Candidate | Votes | % |
| | Republican | Phil Bryant | 112,140 | 57.3 |
| | Republican | Charlie Ross | 83,660 | 42.7 |
| Total votes | 195,800 | 100.0 |
General election
Results
2007 Mississippi Lieutenant Governor election[6] | Party | Candidate | Votes | % |
| | Republican | Phil Bryant | 432,152 | 58.6 |
| | Democratic | Jamie Franks | 305,409 | 41.4 |
| Total votes | 737,561 | 100.0 |
Secretary of State
Mississippi Secretary of State election, 2007
|
| ← 2003 | November 6, 2007 (2007-11-06) | 2011 → |
|
| |  |  | | Nominee | Delbert Hosemann | Robert Smith | | | Party | Republican | Democratic | | Popular vote | 425,228 | 304,917 | | Percentage | 58.2% | 41.8% | |
 County results
Hosemann: 50–60% 60–70% 70–80% 80–90%
Smith: 50–60% 60–70% 70–80% 80–90% |
Secretary of State before election
Eric Clark
Democratic | Elected Secretary of State
Delbert Hosemann
Republican | |
Democratic primary
Candidates
- Robert H. Smith
- Jabari A. Toins
- John Windsor
Results
Democratic primary results[7] | Party | Candidate | Votes | % |
| | Democratic | Robert H. Smith | 307,991 | 72.2 |
| | Democratic | John O. Windsor | 81,464 | 19.2 |
| | Democratic | Jabari A. Toins | 34,409 | 8.1 |
| Total votes | 423,864 | 100.0 |
Republican primary
Candidates
- Delbert Hosemann, lawyer
- Mike Lott, state representative
- Jeffrey Rupp
- Gene Sills
Results
Republican primary results[8] | Party | Candidate | Votes | % |
| | Republican | Delbert Hosemann | 102,093 | 53.8 |
| | Republican | Mike Lott | 64,879 | 34.2 |
| | Republican | Jeffrey Rupp | 17,838 | 9.4 |
| | Republican | Gene Sills | 4,982 | 2.6 |
| Total votes | 189,792 | 100.0 |
General election
Results
2007 Mississippi Secretary of State election[9] | Party | Candidate | Votes | % |
| | Republican | Delbert Hosemann | 425,228 | 58.2 |
| | Democratic | Robert Smith | 304,917 | 41.8 |
| Total votes | 730,145 | 100.0 |
Attorney general
Mississippi Attorney General election, 2007
|
| ← 2003 | November 6, 2007 (2007-11-06) | 2011 → |
|
| |  | | | Nominee | Jim Hood | Al Hopkins | | | Party | Democratic | Republican | | Popular vote | 439,668 | 295,791 | | Percentage | 59.8% | 40.2% | |
 County Results:
Hood: 50–60% 60–70% 70–80% 80–90%
Hopkins: 50–60% 60–70% |
Attorney General before election
Jim Hood
Democratic | Elected Attorney General
Jim Hood
Democratic | |
Democratic nomination
Candidate
- Jim Hood, the incumbent Democratic Attorney General, ran unopposed.[2]
Results
Democratic primary results[10] | Party | Candidate | Votes | % |
| | Democratic | Jim Hood | 316,781 | 100 |
| Total votes | 316,781 | 100.0 |
Republican nomination
Candidate
- Al Hopkins, the Republican candidate, ran unopposed.
Results
Republican primary results[11] | Party | Candidate | Votes | % |
| | Republican | Al Hopkins | 132,910 | 100 |
| Total votes | 132,910 | 100.0 |
General election
Results
2007 Mississippi Attorney General election[12] | Party | Candidate | Votes | % |
| | Democratic | Jim Hood (incumbent) | 439,668 | 59.8 |
| | Republican | Al Hopkins | 295,791 | 40.2 |
| Total votes | 735,459 | 100.0 |
State Auditor
Democratic primary
Candidates
- Todd Brand
- Jacob Ray
- Mike Sumrall
Results
Democratic primary results[10] | Party | Candidate | Votes | % |
| | Democratic | Mike Sumrall | 196,108 | 46.6 |
| | Democratic | Todd Brand | 152,246 | 36.2 |
| | Democratic | Jacob Ray | 72,404 | 17.2 |
| Total votes | 420,758 | 100.0 |
Runoff
Democratic primary runoff results[13] | Party | Candidate | Votes | % |
| | Democratic | Mike Sumrall | 164,980 | 52.9 |
| | Democratic | Todd Brand | 146,807 | 47.1 |
| Total votes | 311,787 | 100.0 |
Republican nomination
Candidate
Results
Republican primary results[14] | Party | Candidate | Votes | % |
| | Republican | Stacey Pickering | 129,561 | 100 |
| Total votes | 129,561 | 100.0 |
General election
Results
2007 Mississippi State Auditor election[15] | Party | Candidate | Votes | % |
| | Republican | Stacey Pickering | 399,721 | 55.0 |
| | Democratic | Mike Sumrall | 327,033 | 45.0 |
| Total votes | 726,754 | 100.0 |
State Treasurer
Democratic nomination
Candidate
Results
Democratic primary results[16] | Party | Candidate | Votes | % |
| | Democratic | Shawn O'Hara | 278,819 | 100 |
| Total votes | 278,819 | 100.0 |
Republican nomination
Candidate
Results
Republican primary results[17] | Party | Candidate | Votes | % |
| | Republican | Tate Reeves | 136,145 | 100 |
| Total votes | 136,145 | 100.0 |
General election
Results
2007 Mississippi State Treasurer election[18] | Party | Candidate | Votes | % |
| | Republican | Tate Reeves (incumbent) | 436,833 | 60.5 |
| | Democratic | Shawn O'Hara | 284,789 | 39.5 |
| Total votes | 721,622 | 100.0 |
Commissioner of Agriculture and Commerce
Mississippi Commissioner of Agriculture and Commerce election, 2007
|
| ← 2003 | November 6, 2007 (2007-11-06) | 2011 → |
|
| |  |  | | Nominee | Lester Spell | Ricky Cole | | | Party | Republican | Democratic | | Popular vote | 371,191 | 308,693 | | Percentage | 51.0% | 42.4% | |
 County results
Spell: 40–50% 50–60% 60–70%
Cole: 40–50% 50–60% 60–70% 70–80% |
Commissioner of Agriculture and Commerce before election
Lester Spell
Republican | Elected Commissioner of Agriculture and Commerce
Lester Spell
Republican | |
Lester Spell was elected as a Democrat in 2003, but changed his party affiliation to Republican ahead of the 2007 elections.
Democratic nomination
Candidate
Results
Democratic primary results[19] | Party | Candidate | Votes | % |
| | Democratic | Rickey Cole | 284,923 | 100 |
| Total votes | 284,923 | 100.0 |
Republican primary
Candidate
Results
Republican primary results[20] | Party | Candidate | Votes | % |
| | Republican | Lester Spell | 102,422 | 54.5 |
| | Republican | Max Phillips | 85,478 | 45.5 |
| Total votes | 187,900 | 100.0 |
General election
Results
2007 Mississippi Commissioner of Agriculture and Commerce election[21] | Party | Candidate | Votes | % |
| | Republican | Lester Spell (incumbent) | 371,191 | 51.0 |
| | Democratic | Ricky Cole | 308,693 | 42.4 |
| | Constitution | Paul Riley | 47,647 | 6.6 |
| Total votes | 727,531 | 100.0 |
Commissioner of Insurance
Mississippi Commissioner of Insurance election, 2007
|
| ← 2003 | November 6, 2007 (2007-11-06) | 2011 → |
|
| |  | | | Nominee | Mike Chaney | Gary Anderson | | | Party | Republican | Democratic | | Popular vote | 415,242 | 319,287 | | Percentage | 56.5% | 43.5% | |
 County results
Chaney: 50–60% 60–70% 70–80%
Anderson: 50–60% 60–70% 70–80% 80–90% |
Commissioner of Insurance before election
George Dale
Democratic | Elected Commissioner of Insurance
Mike Chaney
Republican | |
Democratic primary
Candidates
- Gary Anderson
- George Dale
Results
Democratic primary results[22] | Party | Candidate | Votes | % |
| | Democratic | Gary Anderson | 242,941 | 51.3% |
| | Democratic | George Dale | 230,782 | 48.7 |
| Total votes | 473,723 | 100.0 |
Republican primary
Candidates
Results
Republican primary results[23] | Party | Candidate | Votes | % |
| | Republican | Mike Chaney | 137,685 | 79.0 |
| | Republican | Ronnie D. English | 36,646 | 21.0 |
| Total votes | 174,331 | 100.0 |
General election
Results
2007 Mississippi Commissioner of Insurance election[24] | Party | Candidate | Votes | % |
| | Republican | Mike Chaney | 415,242 | 56.5 |
| | Democratic | Gary Anderson | 319,287 | 43.5 |
| Total votes | 734,529 | 100.0 |
Public Service Commission
Northern District
2007 Mississippi Public Service Commissioner, Northern District election | Party | Candidate | Votes | % | ±% |
| | Democratic | Brandon Presley | 134,405 | 57.9 | |
| | Republican | Mabel Murphree | 97,892 | 42.1 | |
Central District
2007 Mississippi Public Service Commissioner, Central District election | Party | Candidate | Votes | % | ±% |
| | Democratic | Lynn Posey | 122,417 | 50.6 | |
| | Republican | Charles Barbour | 112,782 | 46.6 | |
| | Independent | Lee Dilworth | 6,833 | 2.8 | |
Southern District
2007 Mississippi Public Service Commissioner, Southern District election | Party | Candidate | Votes | % | ±% |
| | Republican | Leonard Bentz (incumbent) | 139,124 | 55.9 | |
| | Democratic | Mike Collier | 109,737 | 44.1 | |
Transportation Commission
Northern District
Democratic incumbent Bill Minor ran unopposed in the general election.
Central District
2007 Mississippi Transportation Commissioner, Central District election | Party | Candidate | Votes | % | ±% |
| | Republican | Dick Hall (incumbent) | 126,145 | 52.2 | |
| | Democratic | Rudolph Warnock | 115,534 | 47.8 | |
Southern District
2007 Mississippi Transportation Commissioner, Southern District election | Party | Candidate | Votes | % | ±% |
| | Democratic | Wayne Brown (incumbent) | 133,029 | 52.5 | |
| | Republican | Larry Benefield | 120,293 | 47.5 | |
References
- ^ "A glance at 2007 Mississippi elections". Picayune Item. March 2, 2007. Retrieved March 13, 2023.
- ^ a b c d e "Mississippi Democratic Primary Results" (PDF). Mississippi Secretary of State. Mississippi Democratic Election Committee. August 17, 2007. Archived from the original (PDF) on July 31, 2008.
- ^ Herring, James H. (August 20, 2007). "Mississippi Republican Party Primary Results" (PDF). Mississippi Secretary of State. Archived from the original (PDF) on December 17, 2015.
- ^ Mississippi Official and Statistical Register 2009, p. 554.
- ^ Mississippi Official and Statistical Register 2009, p. 588.
- ^ Mississippi Official and Statistical Register 2009, p. 621.
- ^ Mississippi Official and Statistical Register 2009, p. 555.
- ^ Mississippi Official and Statistical Register 2009, p. 590.
- ^ Mississippi Official and Statistical Register 2009, p. 623.
- ^ a b Mississippi Official and Statistical Register 2009, p. 557.
- ^ Mississippi Official and Statistical Register 2009, p. 591.
- ^ Mississippi Official and Statistical Register 2009, p. 624.
- ^ Mississippi Official and Statistical Register 2009, p. 615.
- ^ Mississippi Official and Statistical Register 2009, p. 594.
- ^ Mississippi Official and Statistical Register 2009, p. 627.
- ^ Mississippi Official and Statistical Register 2009, p. 558.
- ^ Mississippi Official and Statistical Register 2009, p. 592.
- ^ Mississippi Official and Statistical Register 2009, p. 626.
- ^ Mississippi Official and Statistical Register 2009, p. 562.
- ^ Mississippi Official and Statistical Register 2009, p. 597.
- ^ Mississippi Official and Statistical Register 2009, p. 630.
- ^ Mississippi Official and Statistical Register 2009, p. 561.
- ^ Mississippi Official and Statistical Register 2009, p. 595.
- ^ Mississippi Official and Statistical Register 2009, p. 629.
Works cited
- Mississippi Official and Statistical Register 2008–2012 (PDF). Jackson: Mississippi Secretary of State. 2009.
|
|---|
| U.S. House | - California
- Georgia
- Massachusetts
- Ohio
- Virginia
|
|---|
| Governors | |
|---|
State
legislatures | |
|---|
| Mayoral | - Arlington, TX
- Baltimore, MD
- Charlotte, NC
- Chicago, IL
- Colorado Springs, CO
- Columbus, OH
- Dallas, TX
- Denver, CO
- Des Moines, IA
- Durham, NC
- Evansville, IN
- Fort Wayne, IN
- Forth Worth, TX
- Green Bay, WI
- Hartford, CT
- Houston, TX
- Indianapolis, IN
- Jacksonville, FL
- Kansas City, MO
- Knoxville, TN
- Las Vegas, NV
- Madison, WI
- Manchester, NH
- Memphis, TN
- Montgomery, AL
- Nashville, TN
- Philadelphia, PA
- Phoenix, AZ
- Pittsburgh, PA
- Raleigh, NC
- San Francisco, CA
- Salt Lake City, UT
- San Francisco, CA
- Springfield, MA
- South Bend, IN
- Tampa, FL
- Tucson, AZ
- Wichita, KS
- Worcester, MA
|
|---|
| City | |
|---|
| State | |
|---|
| Territories | |
|---|