Timeline of the 2015 Atlantic hurricane season
| Timeline of the 2015 Atlantic hurricane season | |||||||
|---|---|---|---|---|---|---|---|
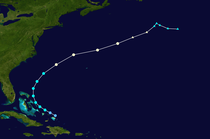
 Season summary map | |||||||
| Season boundaries | |||||||
| First system formed | May 8, 2015 | ||||||
| Last system dissipated | November 12, 2015 | ||||||
| Strongest system | |||||||
| Name | Joaquin | ||||||
| Maximum winds | 155 mph (250 km/h) (1-minute sustained) | ||||||
| Lowest pressure | 931 mbar (hPa; 27.49 inHg) | ||||||
| Longest lasting system | |||||||
| Name | Joaquin | ||||||
| Duration | 10 days | ||||||
| |||||||
| Other years 2013, 2014, 2015, 2016, 2017 | |||||||
The 2015 Atlantic hurricane season was an event in the annual hurricane season in the north Atlantic ocean.(there were 15 different recorded hurricanes this year). It was the third consecutive year to feature below-average tropical cyclone activity,[nb 1] with eleven named storms. The season officially began on June 1, 2015 and ended on November 30, 2015. These dates, adopted by convention, historically describe the period in each year when most tropical systems form.[2] However, systems can and do form outside these dates, as did the season's first storm, Tropical Storm Ana, which developed on May 8; the season's final storm, Hurricane Kate, lost its tropical characteristics on November 11.
The year featured twelve tropical cyclones, of which eleven became tropical storms, including four hurricanes of which two intensified into major hurricanes.[nb 2] While no hurricanes made landfall on the United States mainland during the year, two tropical storms, Ana and Bill, struck the coastline of South Carolina and Texas respectively. Ana was earliest landfalling tropical storm on record in the United States and caused two fatalities, while Bill produced heavy rain and flooding and caused eight fatalities. Additionally, the precursor to Bill also caused significant flooding across Central America. In late August, Tropical Storm Erika brought heavy rainfall to several Leeward Islands, especially to Dominica. It caused widespread damage and 31 fatalities. In October, Hurricane Joaquin, a Category 4 hurricane, battered The Bahamas for two days, causing extensive devastation to that nation while also contributing to historic flooding across the Southeastern United States. Additionally, Joaquin was responsible sinking of the American cargo ship El Faro and for the deaths of its 33–member crew. Following the 2015 season, the names Erika and Joaquin were retired from reuse in the North Atlantic by the World Meteorological Organization.[4][5]
This timeline documents tropical cyclone formations, strengthening, weakening, landfalls, extratropical transitions, and dissipations during the season. It includes information that was not released throughout the season, meaning that data from post-storm reviews by the National Hurricane Center, such as a storm that was not initially warned upon, has been included.
By convention, meteorologists use one time zone when issuing forecasts and making observations: Coordinated Universal Time (UTC), and also use the 24-hour clock (where 00:00 = midnight UTC).[6] The National Hurricane Center uses both UTC and the time zone where the center of the tropical cyclone is currently located. The time zones utilized (east to west) prior to 2020 were: Atlantic, Eastern, and Central.[7] In this timeline, all information is listed by UTC first with the respective regional time included in parentheses. Additionally, figures for maximum sustained winds and position estimates are rounded to the nearest 5 units (knots, miles, or kilometers), following the convention used in the National Hurricane Center's products. Direct wind observations are rounded to the nearest whole number. Atmospheric pressures are listed to the nearest millibar and nearest hundredth of an inch of mercury.
Timeline

May
May 8
- 00:00 UTC (8:00 p.m. EDT, May 7) at 31°24′N 77°36′W / 31.4°N 77.6°W / 31.4; -77.6 (Subtropical Storm Ana forms) – Subtropical Storm Ana forms from a non-tropical low about 175 mi (280 km) south-southeast of Myrtle Beach, South Carolina.[8]

May 9
- 00:00 UTC (8:00 p.m. EDT, May 8) at 31°54′N 77°18′W / 31.9°N 77.3°W / 31.9; -77.3 (Subtropical Storm Anna attains peak intensity) – Subtropical Storm Ana attains its peak intensity with maximum sustained winds of 60 mph (95 km/h) and a minimum barometric pressure of 998 mbar (29.47 inHg), about 150 mi (240 km) southeast of Myrtle Beach, South Carolina.[8]
- 06:00 UTC (2:00 a.m. EDT) at 32°12′N 77°30′W / 32.2°N 77.5°W / 32.2; -77.5 (Subtropical Storm Ana transitions into a tropical storm) – Subtropical Storm Ana transitions into a tropical storm about 130 mi (215 km) southeast of Myrtle Beach.[8]
May 10
- 10:00 UTC (6:00 a.m. EDT) at 33°48′N 78°48′W / 33.8°N 78.8°W / 33.8; -78.8 (Tropical Storm Ana makes landfall) – Tropical Storm Ana makes landfall about 10 mi (15 km) southwest of North Myrtle Beach, South Carolina with winds of 45 mph (75 km/h).[8]
- 18:00 UTC (2:00 p.m. EDT) at 34°12′N 78°42′W / 34.2°N 78.7°W / 34.2; -78.7 (Tropical Storm Ana weakens to a tropical depression) – Tropical Storm Ana weakens to a tropical depression about 30 mi (45 km) north of North Myrtle Beach.[8]
May 12
- 00:00 UTC (8:00 p.m. EDT, May 11) at 38°06′N 75°06′W / 38.1°N 75.1°W / 38.1; -75.1 (Tropical Depression Ana degenerates into a remnant low) – Tropical Depression Ana degenerates into a remnant low as it moves off of the Delmarva Peninsula, and subsequently merges with a frontal system.[8]
June
June 1
- The 2015 Atlantic hurricane season officially begins.[2]

June 16
- 00:00 UTC (7:00 p.m. CDT, June 15) at 27°00′N 94°18′W / 27.0°N 94.3°W / 27.0; -94.3 (Tropical Storm Bill forms) – Tropical Storm Bill develops as a result of the interaction of an upper-level trough and a broad area of low pressure about 200 mi (325 km) east-southeast of Corpus Christi, Texas.[9]
- 12:00 UTC (7:00 a.m. CDT) at 28°00′N 96°00′W / 28.0°N 96.0°W / 28.0; -96.0 (Tropical Storm Bill attains peak intensity) – Tropical Storm Bill attains its peak intensity with maximum sustained winds of 60 mph (95 km/h) and a minimum pressure of 997 mbar (29.44 inHg), about 85 mi (140 km) east-northeast of Corpus Christi.[9]
- 16:45 UTC (11:45 a.m. CDT) at 28°12′N 96°42′W / 28.2°N 96.7°W / 28.2; -96.7 (Tropical Storm Bill makes landfall) – Tropical Storm Bill makes landfall on Matagorda Island, Texas, with winds of 60 mph (95 km/h).[9]
June 17
- 06:00 UTC (1:00 a.m. CDT) at 30°18′N 97°06′W / 30.3°N 97.1°W / 30.3; -97.1 (Tropical Storm Bill weakens to a tropical depression) – Tropical Storm Bill weakens to a tropical depression about 35 mi (55 km) east of Austin, Texas.[9]
June 18
- 18:00 UTC (1:00 p.m. CDT) at 35°12′N 95°30′W / 35.2°N 95.5°W / 35.2; -95.5 (Tropical Depression Bill degenerates into remnant low) – Tropical Depression Bill degenerates into remnant low about 75 mi (120 km) south-southeast of Tulsa, Oklahoma, and subsequently dissipates.[9]
July
July 13
- 06:00 UTC (2:00 a.m. AST) at 36°00′N 71°06′W / 36.0°N 71.1°W / 36.0; -71.1 (Tropical Depression develops) – A tropical depression develops from a shortwave trough about 255 mi (410 km) east-northeast of Cape Hatteras, North Carolina.[10]
- 12:00 UTC (8:00 a.m. AST) at 36°48′N 69°24′W / 36.8°N 69.4°W / 36.8; -69.4 (Tropical Depression becomes Tropical Storm Claudette) – The tropical depression intensifies into Tropical Storm Claudette about 350 mi (565 km) east of Cape Hatteras.[10]
- 18:00 UTC (2:00 p.m. AST) at 37°36′N 67°30′W / 37.6°N 67.5°W / 37.6; -67.5 (Tropical Storm Claudette attains peak intensity) – Tropical Storm Claudette attains its peak intensity with maximum sustained winds of 50 mph (85 km/h) and a minimum pressure of 1,003 mbar (29.62 inHg), about 315 mi (510 km) south-southeast of Cape Cod, Massachusetts.[10]
July 15
- 00:00 UTC (8:00 p.m. AST, July 14) at 43°30′N 58°12′W / 43.5°N 58.2°W / 43.5; -58.2 (Tropical Storm Claudette degenerates into a remnant low) – Tropical Storm Claudette degenerates into a remnant low about 270 mi (435 km) southwest of Newfoundland, and is later absorbed by a frontal system.[10]
August
August 18
- 06:00 UTC (2:00 a.m. AST) at 10°24′N 34°48′W / 10.4°N 34.8°W / 10.4; -34.8 (Tropical Depression Four develops) – Tropical Depression Four develops from a tropical wave about 825 mi (1,325 km) west-southwest of Praia, Cape Verde.[11]
- 12:00 UTC (8:00 a.m. AST) at 10°30′N 35°54′W / 10.5°N 35.9°W / 10.5; -35.9 (Tropical Depression Four becomes Tropical Storm Danny) – Tropical Depression Four intensifies into Tropical Storm Danny about 890 mi (1,435 km) west-southwest of Praia.[11]

August 20
- 12:00 UTC (8:00 a.m. AST) at 12°18′N 44°24′W / 12.3°N 44.4°W / 12.3; -44.4 (Tropical Storm Danny intensifies into a Category 1 hurricane) – Tropical Storm Danny intensifies into a Category 1 hurricane about 1,095 mi (1,760 km) east of the Windward Islands.[11]
August 21
- 00:00 UTC (8:00 p.m. AST, August 20) at 13°12′N 46°12′W / 13.2°N 46.2°W / 13.2; -46.2 (Hurricane Danny intensifies to Category 2) – Hurricane Danny intensifies into a Category 2 hurricane about 965 mi (1,555 km) east of the Windward Islands.[11]
- 12:00 UTC (8:00 a.m. AST) at 13°48′N 47°48′W / 13.8°N 47.8°W / 13.8; -47.8 (Hurricane Danny intensifies to Category 3) – Hurricane Danny intensifies into a Category 3 hurricane and simultaneously attains its peak intensity with maximum sustained winds of 125 mph (205 km/h) and a minimum pressure of 960 mbar (28.35 inHg), about 855 mi (1,380 km) east of the Windward Islands.[11]
August 22
- 00:00 UTC (8:00 p.m. AST, August 21) at 14°42′N 49°24′W / 14.7°N 49.4°W / 14.7; -49.4 (Hurricane Danny weakens to Category 2) – Hurricane Danny weakens to a Category 2 hurricane about 750 mi (1,205 km) east of the Windward Islands.[11]
- 12:00 UTC (8:00 a.m. AST) at 15°18′N 51°24′W / 15.3°N 51.4°W / 15.3; -51.4 (Hurricane Danny weakens to Category 1) – Hurricane Danny weakens to a Category 1 hurricane about 620 mi (1,000 km) east of the Windward Islands.[11]
August 23
- 00:00 UTC (8:00 p.m. AST, August 22) at 15°36′N 54°00′W / 15.6°N 54.0°W / 15.6; -54.0 (Hurricane Danny weakens to a tropical storm) – Hurricane Danny weakens to a tropical storm about 450 mi (720 km) east of the Windward Islands.[11]
August 24
- 12:00 UTC (8:00 a.m. AST) – at 15°48′N 61°18′W / 15.8°N 61.3°W / 15.8; -61.3 (Tropical Storm Danny weakens to a tropical depression) – Tropical Storm Danny weakens to a tropical depression about 120 mi (195 km) east of the Windward Islands, and later degenerates into an open wave.[11]
- 18:00 UTC (2:00 p.m. AST) – at 14°18′N 45°06′W / 14.3°N 45.1°W / 14.3; -45.1 (Tropical Storm Erika forms) – Tropical Storm Erika forms from a tropical wave about 1,035 mi (1,665 km) east of the Lesser Antilles.[12]

August 27
- 06:00 UTC (2:00 a.m. AST) at 16°30′N 60°48′W / 16.5°N 60.8°W / 16.5; -60.8 (Tropical Storm Erika attains peak intensity) – Tropical Storm Erika attains its peak intensity with maximum sustained winds of 50 mph (85 km/h) and a minimum pressure of 1,001 mbar (29.56 inHg), about 45 mi (75 km) east of northern tip of Guadeloupe.[12]
August 28
- 12:00 UTC (9:30 a.m. EDT) at 17°36′N 68°36′W / 17.6°N 68.6°W / 17.6; -68.6 (Tropical Storm Erika degenerates into a remnant low) – Tropical Storm Erika degenerates into a remnant low about 45 mi (75 km) south of the eastern tip of Hispaniola, and subsequently dissipates.[12]
August 30
- 00:00 UTC (8:00 p.m. AST, August 29) at 11°36′N 17°30′W / 11.6°N 17.5°W / 11.6; -17.5 (Tropical Depression Six develops) – Tropical Depression Six develops from a tropical wave about 300 mi (480 km) west-northwest of Conakry, Guinea.[13]
- 06:00 UTC (2:00 a.m. AST) at 12°12′N 18°24′W / 12.2°N 18.4°W / 12.2; -18.4 (Tropical Depression Six intensifies into Tropical Storm Fred) – Tropical Depression Six intensifies into Tropical Storm Fred about 370 mi (595 km) northwest of Conakry.[13]

August 31
- 00:00 UTC (8:00 p.m. AST, August 30) at 14°36′N 21°42′W / 14.6°N 21.7°W / 14.6; -21.7 (Tropical Storm Fred intensifies into a Category 1 hurricane) – Tropical Storm Fred intensifies into a Category 1 hurricane about 165 mi (270 km) south-southeast of Sal, Cape Verde.[13]
- 12:00 UTC (8:00 a.m. AST) at 16°06′N 23°18′W / 16.1°N 23.3°W / 16.1; -23.3 (Hurricane Fred attains its peak intensity) – Hurricane Fred attains its peak intensity with maximum sustained winds of 85 mph (140 km/h) and a minimum pressure of 986 mbar (29.12 inHg), about 50 mi (85 km) south-southwest of Sal.[13]
September
September 1
- 06:00 UTC (2:00 a.m. AST) at 17°48′N 25°42′W / 17.8°N 25.7°W / 17.8; -25.7 (Hurricane Fred weakens to a tropical storm) – Hurricane Fred weakens to a tropical storm about 195 mi (315 km) west of Sal.[13]
September 4
- 12:00 UTC (8:00 a.m. AST) at 22°12′N 37°54′W / 22.2°N 37.9°W / 22.2; -37.9 (Tropical Storm Fred weakens to a tropical depression) – Tropical Storm Fred weakens to a tropical depression about 1,250 mi (2,010 km) southwest of the Azores.[13]
September 5
- 00:00 UTC (8:00 p.m. AST, September 4) at 22°42′N 39°36′W / 22.7°N 39.6°W / 22.7; -39.6 (Tropical Depression Fred re-intensifies into a tropical storm) – Tropical Depression Fred re-intensifies into a tropical storm about 1,265 mi (2,035 km) southwest of the Azores.[13]
- 06:00 UTC (2:00 a.m. AST) at 12°00′N 23°06′W / 12.0°N 23.1°W / 12.0; -23.1 (Tropical Depression Seven develops) – Tropical Depression Seven develops from a tropical wave about 175 mi (280 km) south of the Cape Verde Islands.[14]
- 12:00 UTC (8:00 a.m. AST) at 23°18′N 41°30′W / 23.3°N 41.5°W / 23.3; -41.5 (Tropical Storm Fred again weakens to a tropical depression) – Tropical Storm Fred again weakens to a tropical depression, about 1,295 mi (2,085 km) southwest of the Azores, and later degenerates into a trough.[13]
- 18:00 UTC (2:00 p.m. AST) at 12°18′N 25°42′W / 12.3°N 25.7°W / 12.3; -25.7 (Tropical Depression Seven intensifies into Tropical Storm Grace) – Tropical Depression Seven intensifies into Tropical Storm Grace about 185 mi (295 km) south-southwest of the Cape Verde Islands.[14]
September 6
- 12:00 UTC (8:00 a.m. AST) at 12°42′N 29°12′W / 12.7°N 29.2°W / 12.7; -29.2 (Tropical Storm Grace attains peak intensity) – Tropical Storm Grace attains its peak intensity with maximum sustained winds of 60 mph (95 km/h) and a minimum barometric pressure of 1,000 mbar (29.53 inHg), about 335 mi (540 km) southwest of the Cape Verde Islands.[14]
September 8
- 12:00 UTC (8:00 a.m. AST) at 14°00′N 41°48′W / 14.0°N 41.8°W / 14.0; -41.8 (Tropical Storm Grace weakens to a tropical depression) – Tropical Storm Grace weakens to a tropical depression about 1,150 mi (1,850 km) west of the Cape Verde Islands, and later degenerates into a trough.[14]
- 18:00 UTC (2:00 p.m. AST) at 30°48′N 61°36′W / 30.8°N 61.6°W / 30.8; -61.6 (Tropical Depression Eight develops) – Tropical Depression Eight develops from a non-tropical weather system about 215 mi (345 km) southeast of Bermuda.[15]
September 9
- 00:00 UTC (8:00 p.m. AST, September 8) at 30°48′N 61°24′W / 30.8°N 61.4°W / 30.8; -61.4 (Tropical Depression Eight becomes Tropical Storm Henri) – Tropical Depression Eight intensifies into Tropical Storm Henri about 220 mi (355 km) southeast of Bermuda.[15]
- 18:00 UTC (2:00 p.m. AST) at 30°54′N 60°48′W / 30.9°N 60.8°W / 30.9; -60.8 (Tropical Storm Henri attains peak intensity) – Tropical Storm Henri attains its peak intensity with maximum sustained winds of 50 mph (85 km/h) and a minimum barometric pressure of 1,003 mbar (29.62 inHg), about 250 mi (400 km) east-southeast of Bermuda.[15]
September 11
- 06:00 UTC (2:00 a.m. AST) at 35°42′N 60°18′W / 35.7°N 60.3°W / 35.7; -60.3 – Tropical Storm Henri degenerates into a trough, about 340 mi (545 km) northeast of Bermuda, and subsequently merges with a large extratropical cyclone.[15]
September 16
- 12:00 UTC (8:00 a.m. AST) at 14°30′N 43°42′W / 14.5°N 43.7°W / 14.5; -43.7 (Tropical Depression Nine develops) – Tropical Depression Nine develops from a tropical wave about 1,265 mi (2,035 km) west of the Cape Verde Islands.[16]
September 17
- 06:00 UTC (2:00 a.m. AST) at 15°36′N 45°00′W / 15.6°N 45.0°W / 15.6; -45.0 (Tropical Depression Nine attains peak intensity) – Tropical Depression Nine attains its peak intensity with maximum sustained winds of 35 mph (55 km/h) and a minimum barometric pressure of 1,006 mbar (29.71 inHg), about 1,065 mi (1,715 km) east of the Lesser Antilles.[16][17]
September 18
- 06:00 UTC (2:00 a.m. AST) at 12°54′N 35°42′W / 12.9°N 35.7°W / 12.9; -35.7 (Tropical Depression Ten develops) – Tropical Depression Ten develops from a tropical wave about 750 mi (1,205 km) west of the southernmost Cape Verde Islands.[18]

September 19
- 00:00 UTC (8:00 p.m. AST, September 18) at 13°36′N 37°24′W / 13.6°N 37.4°W / 13.6; -37.4 (Tropical Depression Ten intensifies into Tropical Storm Ida) – Tropical Depression Ten intensifies into Tropical Storm Ida about 855 mi (1,375 km) west of the southernmost Cape Verde Islands.[18]
- 12:00 UTC (8 a.m. AST) at 18°30′N 49°24′W / 18.5°N 49.4°W / 18.5; -49.4 (Tropical Depression Nine weakens) – Tropical Depression Nine is assessed with a Dvorak classification of too weak to classify as a tropical depression; it dissipates a few hours later, about 805 mi (1,295 km) east of the northern Leeward Islands.[16][19]
September 21
- 12:00 UTC (8:00 a.m. AST) at 20°30′N 48°06′W / 20.5°N 48.1°W / 20.5; -48.1 (Tropical Storm Ida attains peak intensity) – Tropical Storm Ida attains its peak intensity with maximum sustained winds of 50 mph (85 km/h) and a minimum barometric pressure of 1,001 mbar (29.56 inHg), about 990 mi (1,595 km) east of the northern Leeward Islands.[18]
September 24
- 06:00 UTC (2:00 a.m. AST) at 19°36′N 45°36′W / 19.6°N 45.6°W / 19.6; -45.6 (Tropical Storm Ida weakens to a tropical depression) – Tropical Storm Ida weakens to a tropical depression about 1,145 mi (1,845 km) east of the northern Leeward Islands.[18]
September 27
- 12:00 UTC (8:00 a.m. AST) at 24°36′N 48°06′W / 24.6°N 48.1°W / 24.6; -48.1 (Tropical Depression Ida becomes a remnant low) – Tropical Depression Ida degenerates into a remnant low about 1,060 mi (1,705 km) east of the northern Leeward Islands, and later degenerates into a trough.[18]
September 28
- 00:00 UTC (8:00 p.m. AST, September 27) at 27°24′N 69°00′W / 27.4°N 69.0°W / 27.4; -69.0 (Tropical Depression Eleven develops) – Tropical Depression Eleven develops from a weak mid- to upper-tropospheric low about 415 mi (665 km) northeast of San Salvador Island, Bahamas.[20]
September 29
- 00:00 UTC (8:00 p.m. EDT, September 28) at 26°54′N 70°06′W / 26.9°N 70.1°W / 26.9; -70.1 (Tropical Depression Eleven intensifies into Tropical Storm Joaquin) – Tropical Depression Eleven intensifies into Tropical Storm Joaquin about 340 mi (545 km) northeast of San Salvador Island.[20]
September 30
- 06:00 UTC (2:00 a.m. EDT) at 25°24′N 71°48′W / 25.4°N 71.8°W / 25.4; -71.8 (Tropical Storm Joaquin intensifies into a hurricane) – Tropical Storm Joaquin intensifies into a Category 1 hurricane about 195 mi (315 km) east-northeast of San Salvador Island.[20]

October
October 1
- 00:00 UTC (8:00 p.m. EDT, September 30) at 23°54′N 72°54′W / 23.9°N 72.9°W / 23.9; -72.9 (Hurricane Joaquin intensifies to Category 3) – Hurricane Joaquin intensifies into a Category 3 hurricane about 105 mi (165 km) east of San Salvador Island.[20]
- 12:00 UTC (8:00 a.m. EDT) at 23°06′N 73°42′W / 23.1°N 73.7°W / 23.1; -73.7 (Hurricane Joaquin intensifies to Category 4 and makes landfall) – Hurricane Joaquin intensifies into a Category 4 hurricane and makes landfall on Samana Cay, Bahamas, with winds of 130 mph (215 km/h).[20]
October 2
- 00:00 UTC (8:00 p.m. EDT, October 1) at 22°54′N 74°24′W / 22.9°N 74.4°W / 22.9; -74.4 (Hurricane Joaquin reach its minimum barometric pressure) – Hurricane Joaquin reach an initial peak windspeed of 140 mph (220 km/h) and its overall minimum barometric pressure of 931 mbar (27.49 inHg) when its eye was located about 15 mi (25 km) north-northwest of Crooked Island, Bahamas.[20]
- 16:00 UTC (12:00 p.m. EDT) at 23°36′N 74°48′W / 23.6°N 74.8°W / 23.6; -74.8 (Hurricane Joaquin weakens to Category 3 and makes landfall) – Hurricane Joaquin weakens to a Category 3 hurricane and makes landfall on Rum Cay, Bahamas, with winds of 125 mph (205 km/h).[20]
- 21:00 UTC (5:00 p.m. EDT) at 24°06′N 74°30′W / 24.1°N 74.5°W / 24.1; -74.5 (Hurricane Joaquin makes third landfall) – Hurricane Joaquin makes landfall on San Salvador Island, with winds of 125 mph (205 km/h).[20]
October 3
- 00:00 UTC (8:00 p.m. EDT, October 2) at 24°18′N 74°18′W / 24.3°N 74.3°W / 24.3; -74.3 (Hurricane Joaquin re-intensifies to Category 4) – Hurricane Joaquin re-intensifies into a Category 4 hurricane about 15 mi (30 km) north-northeast of San Salvador Island.[20]
- 12:00 UTC (8:00 a.m. EDT) at 25°24′N 72°36′W / 25.4°N 72.6°W / 25.4; -72.6 (Hurricane Joaquin attains its peak sustained winds) – Hurricane Joaquin attains its peak maximum sustained winds of 155 mph (250 km/h), about 150 mi (240 km) northeast of San Salvador Island.[20]
October 4
- 06:00 UTC (2:00 a.m. EDT) at 28°54′N 68°18′W / 28.9°N 68.3°W / 28.9; -68.3 (Hurricane Joaquin weakens to Category 3) – Hurricane Joaquin weakens to a Category 3 hurricane about 315 mi (505 km) southwest of Bermuda.[20]
- 12:00 UTC (8:00 a.m. EDT) at 30°24′N 67°12′W / 30.4°N 67.2°W / 30.4; -67.2 (Hurricane Joaquin weakens to Category 2) – Hurricane Joaquin weakens to a Category 2 hurricane about 195 mi (310 km) southwest of Bermuda.[20]
October 5
- 00:00 UTC (8:00 p.m. EDT, October 4) at 32°36′N 66°00′W / 32.6°N 66.0°W / 32.6; -66.0 (Hurricane Joaquin weakens to a Category 1) – Hurricane Joaquin weakens to a Category 1 hurricane about 70 mi (115 km) west-northwest of Bermuda.[20]
October 7
- 12:00 UTC (8:00 a.m. EDT) at 41°00′N 47°30′W / 41.0°N 47.5°W / 41.0; -47.5 (Hurricane Joaquin weakens to a tropical storm) – Hurricane Joaquin weakens to a tropical storm about 485 mi (780 km) southeast of Cape Race, Newfoundland.[20]
October 8
- 00:00 UTC (8:00 p.m. EDT, October 7) at 43°54′N 24°06′W / 43.9°N 24.1°W / 43.9; -24.1 (Tropical Storm Joaquin becomes extratropical) – Tropical Storm Joaquin transitions into an extratropical cyclone about 445 mi (715 km) west-northwest of the Azores, and subsequently dissipates.[20]
November
November 8
- 18:00 UTC (1:00 p.m. EST) at 22°12′N 71°30′W / 22.2°N 71.5°W / 22.2; -71.5 (Tropical Depression Twelve develops) – Tropical Depression Twelve develops from a tropical wave about 30 mi (45 km) north of the Turks and Caicos Islands.[21]
November 9
- 06:00 UTC (1:00 a.m. EST) at 23°24′N 73°42′W / 23.4°N 73.7°W / 23.4; -73.7 (Tropical Depression Twelve intensifies into Tropical Storm Kate) – Tropical Depression Twelve intensifies into Tropical Storm Kate near the central Bahamas, about 80 mi (130 km) southeast of San Salvador Island, Bahamas.[21][22]
November 11
- 00:00 UTC (8:00 p.m. AST, November 10) at 33°06′N 71°18′W / 33.1°N 71.3°W / 33.1; -71.3 (Tropical Storm Kate intensifies into a hurricane) – Tropical Storm Kate intensifies into a Category 1 hurricane about 390 mi (630 km) west of Bermuda.[21]
- 12:00 UTC (8:00 a.m. AST) at 36°12′N 62°30′W / 36.2°N 62.5°W / 36.2; -62.5 (Hurricane Kate attains peak intensity) – Hurricane Kate attains its peak intensity with maximum sustained winds of 85 mph (140 km/h) and a minimum barometric pressure of 980 mbar (28.94 inHg), about 295 mi (470 km) northeast of Bermuda.[21]
November 12
- 00:00 UTC (8:00 p.m. AST, November 11) at 38°54′N 55°00′W / 38.9°N 55.0°W / 38.9; -55.0 (Hurricane Kate becomes extratropical) – Hurricane Kate transitions into an extratropical cyclone about 710 mi (1,140 km) northeast of Bermuda, and is subsequently absorbed by a larger extratropical cyclone.[21]
November 30
- The 2015 Atlantic hurricane season officially ends.[2]
See also
 Tropical cyclones portal

- Lists of Atlantic hurricanes
- Timeline of the 2015 Pacific hurricane season
- Timeline of the 2015 Pacific typhoon season
Notes
- ^ An average Atlantic hurricane season, as defined by the National Oceanic and Atmospheric Administration, has 12 tropical storms, six hurricanes and two major hurricanes.[1]
- ^ Hurricanes reaching Category 3 (111 miles per hour (179 km/h)) and higher on the 5-level Saffir–Simpson wind speed scale are considered major hurricanes.[3]
References
- ^ "Background Information: North Atlantic Hurricane Season". College Park, Maryland: NOAA Climate Prediction Center. Retrieved July 23, 2020.
- ^ a b c Dorst, Neal (June 1, 2018). "Hurricane Season Information". Frequently Asked Questions About Hurricanes. Miami, Florida: NOAA Atlantic Oceanographic and Meteorological Laboratory. Retrieved June 29, 2020.
- ^ "Saffir-Simpson Hurricane Wind Scale". Miami, Florida: National Hurricane Center. Retrieved July 23, 2020.
- ^ "Tropical Cyclone Naming History and Retired Names". Miami, Florida: National Hurricane Center. Retrieved July 23, 2020.
- ^ "World Meteorological Organization retires storm names Erika, Joaquin and Patricia". Silver Spring, Maryland: National Oceanic and Atmospheric Administration. April 25, 2016. Retrieved July 16, 2021.
- ^ "Understanding the Date/Time Stamps". Miami, Florida: NOAA National Hurricane Center. Retrieved July 10, 2020.
- ^ "Update on National Hurricane Center Products and Services for 2020" (PDF). Miami, Florida: National Hurricane Center. April 20, 2020. Retrieved May 17, 2020.
- ^ a b c d e f Stewart, Stacy R. (September 15, 2015). Tropical Cyclone Report: Tropical Storm Ana (PDF) (Report). Miami, Florida: National Hurricane Center. Retrieved December 9, 2015.
- ^ a b c d e Berg, Robbie J. (September 9, 2015). Tropical Cyclone Report: Tropical Storm Bill (PDF) (Report). Miami, Florida: National Hurricane Center. Retrieved October 5, 2015.
- ^ a b c d Avila, Lixion A. (August 14, 2015). Tropical Cyclone Report: Tropical Storm Claudette (PDF) (Report). Miami, Florida: National Hurricane Center. Retrieved October 6, 2015.
- ^ a b c d e f g h i Stewart, Stacy R. (January 19, 2016). Tropical Cyclone Report: Hurricane Danny (PDF) (Report). Miami, Florida: National Hurricane Center. Retrieved January 21, 2016.
- ^ a b c Pasch, Richard J.; Penny, Andrew B. (February 8, 2016). Tropical Cyclone Report: Tropical Storm Erika (PDF) (Report). Miami, Florida: National Hurricane Center. Retrieved July 11, 2021.
- ^ a b c d e f g h Beven, John L. (January 20, 2016). Tropical Cyclone Report: Hurricane Fred (PDF) (Report). Miami, Florida: National Hurricane Center. Retrieved January 21, 2016.
- ^ a b c d Blake, Eric S. (November 21, 2015). Tropical Cyclone Report: Tropical Storm Grace (PDF) (Report). Miami, Florida: National Hurricane Center. Retrieved December 10, 2015.
- ^ a b c d Kimberlain, Todd B. (October 21, 2015). Tropical Cyclone Report: Tropical Storm Henri (PDF) (Report). Miami, Florida: National Hurricane Center. Retrieved December 10, 2015.
- ^ a b c Brown, Daniel P. (November 16, 2015). Tropical Cyclone Report: Tropical Depression Nine (PDF) (Report). Miami, Florida: National Hurricane Center. Retrieved December 10, 2015.
- ^ Gutro, Rob (September 18, 2015). "TD9 (Atlantic Ocean)". Hurricane and Typhoon Updates. Greenbelt, Maryland: NASA Goddard Space Flight Center. Retrieved July 14, 2021.
- ^ a b c d e Cangialosi, John P. (November 7, 2015). Tropical Cyclone Report: Tropical Storm Ida (PDF) (Report). Miami, Florida: National Hurricane Center. Retrieved December 10, 2015.
- ^ Brennan, Michael J. (September 19, 2015). Remnants of Nine Discussion Number 14 (Report). Miami, Florida: National Hurricane Center. Retrieved July 14, 2021.
- ^ a b c d e f g h i j k l m n o Berg, Robbie J. (January 12, 2016). Tropical Cyclone Report: Hurricane Joaquin (PDF) (Report). Miami, Florida: National Hurricane Center. Retrieved January 19, 2016.
- ^ a b c d e Avila, Lixion A. (January 4, 2016). Tropical Cyclone Report: Hurricane Kate (PDF) (Report). Miami, Florida: National Hurricane Center. Retrieved January 19, 2016.
- ^ Berg, Robbie J.; Brennan, Michael J. (November 9, 2015). Tropical Depression Twelve Intermediate Advisory Number 1A (Report). Miami, Florida: National Hurricane Center. Retrieved July 14, 2021.
External links
Wikimedia Commons has media related to 2015 Atlantic hurricane season.
- 2015 Tropical Cyclone Advisory Archive, National Hurricane Center and Central Pacific Hurricane Center
- Hurricanes and Tropical Storms – Annual 2015, National Centers for Environmental Information


